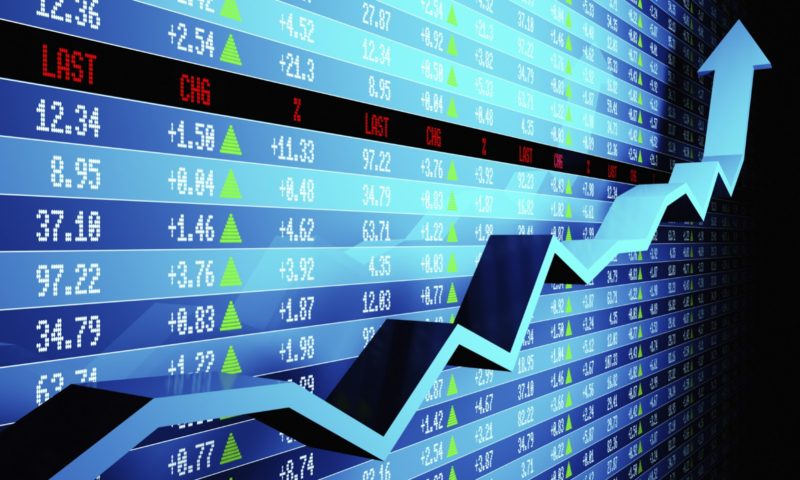
Q3 2018 Ends On A High Note For U.S. Equities
Each of the last candles on all three timeframes for the S&P 500 closed higher than its prior time-period candle.
The most notable feature of the Yearly chart, in particular, is that price could, in fact, reach a resistance target of 3033 (as I described in my post of August 6th) by the end of this year. Such a price level would end up producing a candle range for 2018 on the Yearly timeframe that equals or slightly exceeds the candle range of each of the prior two years. It would also complete a very bullish cycle for this year.