
Weekly Market Review – September 30, 2023
Stock Markets
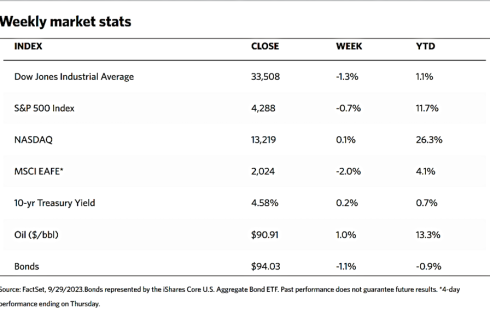
Several geopolitical issues weighed on investor sentiment this week, including higher oil prices pushing inflation worries and the looming U.S. government shutdown in the absence of a bill raising the debt ceiling by September 30. The S&P 500 Index suffered a fourth consecutive weekly decline, closing lower this week by 0.74%. The Dow Jones Industrial Average (DJIA) also fell for the week, by 1.34%, while the D.J. Total Stock Market Index slid by 0.54%. The NYSE Composite was also down by 1.10%. The S&P midcaps and small caps gained some ground, rising by 0.26% and 0.42% respectively, even as the Nasdaq Stock Market Composite Index inched upward by a slim 0.06%. The sector that lost the most ground within the index was utilities, although bucking the trend were energy stocks which outperformed the rest.
Fear that inflation will prove more difficult for central banks to rein in spurred a sell-off in bonds. On Wednesday, the yield on the benchmark 10-year U.S. Treasury note peaked above 4.6%, sending bond prices on a downward spiral (since bond prices and yields move opposite to each other). On the other hand, 10-year Treasury yields inched modestly lower after the release of encouraging eurozone and U.S. inflation data. Also coming under strong selling pressure were tax-exempt municipal bonds and high-yield bonds.
U.S. Economy
The core personal consumption expenditure (PCE) index for August increased 3.9% year-on-year. This is a key inflation indicator that is closely watched by the Federal Reserve as it excludes the volatile food and energy categories. Presently, it is at the lowest annual inflation rate in around two years but still above the central bank’s 2% target rate. The latest reading is a moderation from the upwardly revised 4.3% annual inflation rate recorded in July. The core PCE inflation came in below expectations at 0.1% month-over-month. With all items included, the monthly inflation was driven by high energy prices to rise to 0.4% from 0.2% in July.
Durable goods orders and shipments surprised on the upside, increasing month-over-month in August, despite the weakness in new orders signaled by recent manufacturing surveys. Paced by strength in machinery, headline orders increased by 0.2% whereas consensus expectations had called for a decline. Durable goods orders, excluding transportation, increased by 0.4% from July. This measure is considered to reflect the near-term indicator of the economy’s health. It excludes the transportation category because the big price tags on aircraft and other equipment can distort underlying trends by creating the potential for large orders.
On another front, the Conference Board’s gauge of U.S. consumer confidence slid to 103.0 in September. This outcome is below expectations and is lower than the preceding month’s upwardly revised reading of 108.7. The survey’s expectations component accounts for much of the weakness in this indicator. The component declined by 9.6 points to 73.7, as the percentage of respondents who thought a recession was “somewhat” or “very likely” ticked up after declining in August.
Metals and Mining
The gold market had a significant sell-off this week which dropped the spot price of gold by 4% from Friday the week before. This was the worst week for gold since June 2021. While this looks bad, there is still room for the yellow metal to descend further. Some analysts mentioned that they would not be surprised to see gold prices test once more prices close to the $1,800 per ounce level. Since mid-June, the market has been consolidating between the tight band from $1,900 to $1,980; since the consolidation was relatively lengthy, the breakdown will tend to be violent. Furthermore, the surging momentum in the bond yields and the U.S. dollar pointed to the eventual breakdown in precious metals.
The spot prices of precious metals have exhibited weakness this week. Gold plummeted by 3.98% this week, from its closing price one week ago at $1,925.24 to its closing price this week at $1,848.63 per troy ounce. Silver rose slightly by 0.27% from its closing price last week at $22.12 to its closing price this week at $22.18 per troy ounce. Platinum ended the week lower by 2.45%, from its previous price of $930.73 to its price this week at $907.90 per troy ounce. Palladium closed this week slightly lower by 0.48%, from last week’s closing price of $1,254.23 to this week’s closing price of $1,248.19 per troy ounce. The three-month LME prices of base metals ended mixed. Copper ended this week at $8,270.50 per metric ton, up by 0.93% from the previous price of $8,194.00. Zinc also ended up closing at $2,649.50 per metric ton, gaining by 5.39% from its week-go closing at $2,514.00. Aluminum closed this week at $2,347.00 per metric ton, rising by 6.10% from last week’s close at $2,212.00. Tin ended this week at $23,944.00 per metric ton, falling by 6.52% from last week’s price of $25,613.00.
Energy and Oil
Despite some very bullish news this week, ranging from improving macroeconomic outlook in China to wafer-thin Cushing stocks, oil prices have been trading within a tight range as crude remains overbought and potential surges above $95 per barrel meet with stiff resistance. Crude inventories at the key U.S. storage hub of Cushing, Oklahoma fell to their lowest since July 2022, at 22.0 million barrels. At this level, operators fear operational risks as oil becomes difficult to remove if tank storage holds less than 20 million barrels. Meanwhile, the expiry of November ICE Brent futures has seen backwardation between the expiring month and the December contract shoot up to an astounding $2 per barrel. In the week to come, focus will once more pivot towards Saudi Arabia as OPEC+ meets next week and the market anticipates the announcement of another round of potential production cuts.
Natural Gas
For the report week from Wednesday, September 20 to Wednesday, September 27, 2023, the Henry Hub spot price fell by $0.06 from $2.77 per million British thermal units (MMBtu) to $2.71/MMBtu. The October 2023 NYMEX contract expired by the end of the report week at $2.764/MMBtu, up by $0.03 from the start of the report week. The price of the November 2023 NYMEX contract, which represents the first month of sales of natural gas for winter heating season delivery, decreased to $2.899/MMBtu, down by $0.02 from the start to the end of the report week. The price of the 12-month strip averaging November 2023 through October 2024 futures contracts declined by $0.01 to $3.220/MMBtu.
International natural gas futures prices increased this report week. The weekly average front-month futures prices for liquefied natural gas (LNG) cargoes in East Asia increased by $0.80 to a weekly average of $14.63/MMBtu. Natural gas futures for delivery at the Title Transfer Facility (TTF) in the Netherlands, the most liquid natural gas market in Europe, increased by $1.32 to a weekly average of $12.61/MMBtu, the highest weekly average since late April. In the week last year corresponding to this report week (the week beginning September 21 and ending September 28, 2022), the prices were $39.77/MMBtu in East Asia and $53.45/MMBtu at the TTF.
World Markets
Stocks fell across Europe over the just-concluded week amid concerns about a prolonged period of higher interest rates and a weak Chinese economy. The pan-European STOXX Europe 600 Index ended 0.67% lower in local currency terms. Major stock markets followed the same trend. Italy’s FTSE MIB fell by 1.16%, Germany’s DAX descended by 1.10%, and France’s CAC 40 declined by 0.69%. The UK’s FTSE 100 Index slid by 0.99%. Bond investors focused on the higher-for-longer rates narrative in financial markets, sending European government bond yields broadly up. Germany’s benchmark 10-year government bond yield rose to almost 3%, a level it had not seen in more than ten years, before backing off its peak on Friday. In Italy, amid concerns that the government would need to increase debt issuance next year to finance a bigger deficit, bond yield also advanced. The yield on the UK benchmark 10-year bond climbed above 4.5% before falling back slightly on Friday. In the meantime, Eurozone inflation dropped to 4.3%, its lowest level in two years and weaker than forecasted. This was a marked improvement from August’s 5.2%. The core rate’s initial estimate (excluding food, energy, alcohol, and tobacco) likewise declined from 5.3% to 4.5%.
Japan’s stock market pulled back for the week. The Nikkei declined by 1.7% while the broader TOPIX Index descended by 2.2%. The market reacted to concerns that the U.S. interest rates may potentially remain higher for a longer period, simultaneous with a surge in the price of oil. However, investors welcomed the announcement by the Japanese government that a new economic stimulus plan is about to be launched. Meantime, the Bank of Japan remained staunchly committed to its ultra-accommodative monetary policy stance to keep its inflation target in check, to which the slowing core inflation in the Tokyo area lent support. Regarding the national currency, the yen traded mostly within the JPY 148 range against the U.S. dollar, although it briefly weakened beyond the JPY 149 level and touched an 11-month low before recovering. The move fueled further speculation that the Japanese monetary authorities could intervene in the foreign exchange market to prop up the yen under its repeated declaration that they would respond appropriately to sudden currency fluctuations. The yield on the 10-year Japanese government bond (JGB) rose to 0.76% this week from 0.74% at the end of the previous week.
Chinese stocks declined over the holiday-shortened trading week, during which investor sentiment was dampened by a lack of uplifting economic news. The blue-chip CSI 300 Index and Shanghai Composite Index both lost ground during the week that ended Thursday. Stock Markets in mainland China were closed on Friday which was the start of the 10-day holiday for the Mid-Autumn Festival and National Day. The markets will reopen on Monday, October 9. The Hong Kong benchmark Hang Seng Index fell by 1.37% for the week ended Friday. There were no official economic news released in China during the week. However, a private survey showed that prices in China are recovering, allaying fears of a prolonged deflation. The World Economics survey reported that its all-sector price index for China ascended to a 14-month high in September. The survey was the latest data point indicating that China’s economy may have bottomed out after losing momentum following a post-lockdown recovery in this year’s first quarter. Signs of stabilization in the Chinese economy also appeared to be indicated by official data for August released earlier in September. Retail sales and the industrial economy grew faster than expected year-on-year while unemployment fell unexpectedly from July. On the other hand, fixed-asset investment growth failed to meet expectations due to a steeper decline in property investment.
The Week Ahead
Included in the important economic data for release this week are the unemployment rate for September and other labor market readings including the JOLTS Job Openings report.
Key Topics to Watch
- S&P final U.S. manufacturing PMI
- ISM manufacturing
- Construction spending
- Job openings
- ADP employment
- S&P final U.S. services PMI
- Factory orders
- ISM services
- Initial jobless claims
- U.S. trade deficit
- U.S. employment report
- U.S. employment rate
- U,S. hourly wages
- Hourly wages year-over-year
- Consumer credit
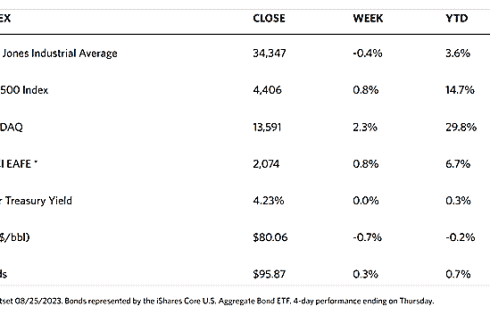
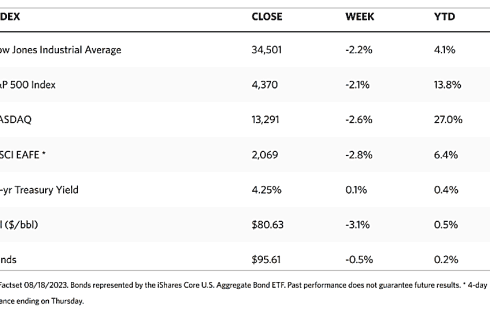
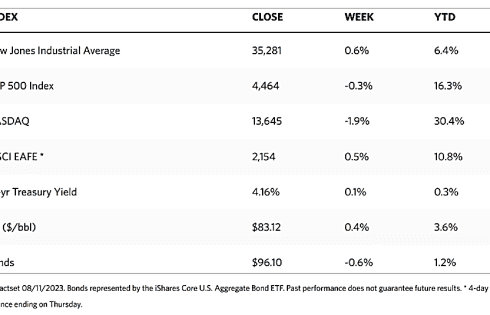
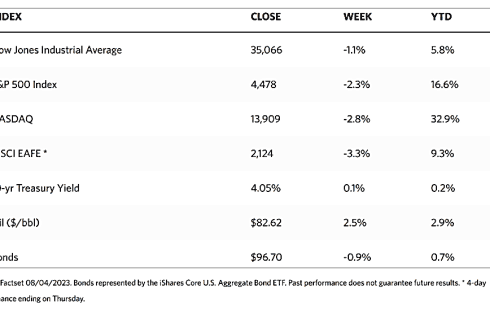
Markets Index Wrap Up