
Weekly Market Review – December 2, 2023
Stock Markets
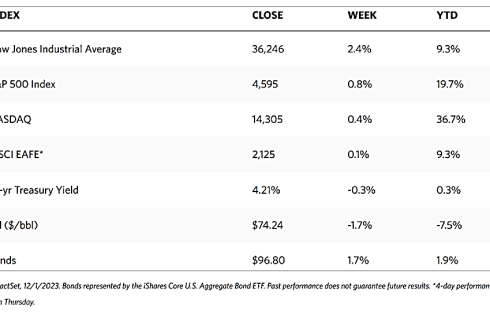
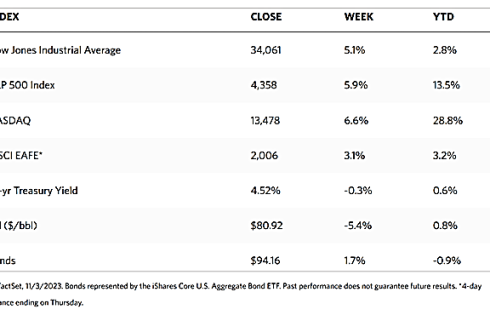
All major indexes ended the week and month on a strong run. According to the Wall Street Journal Market Data, the Dow Jones Industrial Average surged by 2.42% even as the DJ Total Stock Market ended 1.16%. The broad-based S&P 500 Index gained 0.77% while the technology tracker Nasdaq Stock Market Composite advanced by 0.38%. The NYSE Composite likewise added 1.75% for the week. The investor risk indicator CBOE Volatility Index (VIX) rose by 1.36%. The weekly winning streak resulted in the first monthly gain by the S&P 500 for July.
The stellar performance for the last week of November was due to favorable news that addressed all the key concerns of the market. The inflation rate continued on its downtrend to the relief of worried investors, prompting the Federal Reserve to comment that it did not see the need to tighten policy from this point on. Corporate earnings came in better than expected, and the economy appeared to defy the gravity of high interest rates. The encouraging macroeconomic performance in November gave the impression that strengthening fundamentals may support further improvement, although this did not discount the possibility of an occasional hiccup now and then as we advance to 2024. It is safe to say, however, that 2023 is headed towards the market’s highs for the year, which promises to springboard towards a strong opening for the new year.
U.S. Economy
The Commerce Department reported on Thursday that the core personal consumption expenditures (PCE) price index, which excludes food and energy, rose 0.2% in October, marking a slowdown from September. The core PCE index is the Federal Reserve’s preferred inflation gauge since it does not include the more volatile components of consumer spending. This brings the indicator’s year-over-year increase down to 3.5% which is the lowest level since April 2021, although it is still well above the Fed’s 2% target. Core PCE was running even slower over the past six months, chalking up an annualized rate of 2.5%.
A noted Fed hawk, Boar Member Christopher Waller, surprised investors when he announced before the inflation data release that he was “increasingly confident that policy is currently well positioned to slow the economy and get inflation back to 2 percent.” Despite cautioning that further work remained in controlling inflation, he nevertheless acknowledged that “we have seen the most rapid decline in inflation on record,” and that the Fed may start to lower the policy rate if inflation continues to moderate over the coming three to five months.
There was more news to indicate that the economy was indeed headed towards a “soft landing.” In September, personal spending rose by 0.2%, its smallest increase in six months. Personal incomes rose at the same rate. Housing permits rose above expectations although actual starts were lower than expected. The weekly jobless claims inched downward, however, continuing claims climbed above expectations to 1.93 million, their highest level since 2021. The release of the Fed’s Beige Book on Thursday may have boosted hopes that the economy is in the “Goldilocks” scenario – neither too hot nor too cold. The economic activity of the 12 separate districts periodically surveyed by the Fed was split down the middle, with half reporting contraction and the other half reporting growth.
Metals and Mining
Gold did not do much through most of the year, but the past week has given some hope to investors as the precious metals market closed November with strong gains. The market showed its resilience as it bounced off critical support levels and this week set new all-time closing highs. February futures ended the week around $2,090 per ounce and the market realized a healthy gain of more than 4%. Gold prices shot up as investors priced in a potential rate cut as early as March. When the week began, consensus estimated a rate cut by the end of the first quarter of 2024 at 25%. After pronouncements by Fed officials that policy rates may be coming down sooner, those expectations jumped to 52.5%. The worst-case scenario appears to be that the Fed may keep interest rates higher for a little longer than expected, but the central bank’s next move may be likely a cut, making non-yielding assets like precious metals even more attractive.
The spot market for precious metals was mostly up for the week. Gold came from its close last week at $2,000.82 to settle this week at $2,072.22 per troy ounce, up by 3.57%. Silver, which closed a week ago at $24.33, ended this week at $25.49 per troy ounce for a gain of 4.77%. Platinum gained 0.26% over its close last week at $934.75, ending this week with a closing price of $937.15 per troy ounce. Palladium bucked the trend and lost 6.23% from its previous weekly close at $1,073.00 when it ended this week at $1,006.13 per troy ounce. The three-month LME prices for base metals were mixed for this week. Copper came from last week’s close at $8,409.50 to end this week at $8,464.50 per metric ton for a weekly gain of 0.65%. Zinc lost 2.44% from its previous week’s close at $2,537.50 to end this week at $2,475.50 per metric ton. Aluminum descended by 1.42% from its close last week at $2,224.50 to settle this week at $2,193.00 per metric ton. Tin declined by 5.03% from last week’s closing price of $24,476.00 to end this week at $23,246.00 per metric ton.
Energy and Oil
OPEC+ members agreed to voluntary production cuts that total 2.2 million barrels per day (b/d) for the first quarter of 2024. Saudi Arabia, the group’s de facto leader, rolled over its current voluntary cut of 1 million b/d while Russia increased its pledge to 500,000 b/d. The oil market response to the new OPEC+ deal of 2.2 million b/d voluntary cuts was lukewarm, with Brent erasing all its earlier gains and falling back to $81 per barrel. The production target confusion was aggravated by the fact that markets expected deeper cuts, going over and above what Saudi Arabia or Russia have already curbed from their output. These developments led even the most seasoned industry watchers to begin losing track of which country will be cutting what amount against which reference level, adding further confusion to the direction the market will go.
Natural Gas
For the report week beginning Wednesday, November 22, and ending Wednesday, November 29, 2023, the Henry Hub spot price fell by $0.02 from $2.72 per million British thermal units (MMBtu) to $2.70/MMBtu. Regarding the Henry Hub futures price, the December 2023 NYMEX contract expired on November 28, Tuesday, at $2.706/MMBtu, down by $0.19 from the start of the report week. The January 2024 NYMEX contract price decreased to $2.804/MMBtu, down by $0.23 from the start to the end of the report week. The price of the 12-month strip averaging January 2024 through December 2024 futures contracts declined by $0.12 to $2,983/MMBtu.
International natural gas futures prices declined this report week. The weekly average front-month futures prices for liquefied natural gas (LNG) cargoes in East Asia decreased by $0.26 to a weekly average of $16.57/MMBtu. Natural gas futures for delivery at the Title Transfer Facility (TTF) in the Netherlands, the most liquid natural gas market in Europe, decreased by $0.45 to a weekly average of $13.97/MMBtu. In the week last year corresponding to this week (the week from November 23 to November 30, 2022), the prices were $31.01/MMBtu and $40.01/MMBtu in East Asia and at the TTF, respectively.
World Markets
This week European stocks rose on optimism about inflation coming under control. The pan-European STOXX Europe 600 Index closed 1.35% higher on news of a steep decline in inflation and falling bond yields, raising investor sentiment. Major stock indexes in the region similarly rose. France’s CAC 40 Index rose by 0.73%, Italy’s FTSE MIB gained by 1.69%, and Germany’s DAX outperformed both by climbing 2.30%. The UK’s FTSE 100 Index added 0.55%. Lower-than-expected inflation data raised expectations that the European Central Bank (ECB) may consider cutting interest rates next year, sending European government bond yields broadly lower this week. In Germany, the yield on the benchmark 10-year government bond descended to its lowest level in more than four months, while the yield on the benchmark 10-year Italian bond fell toward 4%. Bond yields in the UK bucked the broader trend and rose instead from midweek lows, in reaction to hawkish comments by ECB policymakers who commented that despite the drop in the inflation rate, it is not yet time for rate cuts.
Japan’s stock market ran counter to the broad trend and fell over the week. The Nikkei 225 Index lost by 0.6% while the broader TOPIX Index slid by 0.4%. The sell-off was mostly due to profit-taking after equities rallied in November of expectations that the U.S. interest rates may have peaked. The surging market this month was also supported by a strong corporate earnings season and weakness in the yen that impacted stocks favorably. The yield on the 10-year Japanese government bond fell to 0.71%, from what was 0.77% the week before, tracking the weakness in the U.S. bond market spurred by dovish remarks from the Fed amid signs of slowing economic activity. The yen strengthened to the high-JPY 147 range versus the U.S. dollar from the mid-JPY 149 range in the week before. It was an environment of general weakness in the greenback, due largely to anticipation that policy rates may be cut by the Fed by the first quarter of next year. In the economic arena, the government committed to adopting necessary measures to cushion the negative effects of recent price hikes. It aims to boost growth and help households cope with the rising cost of living by adopting a new economic stimulus package worth more than USD 110 billion.
Chinese stocks likewise declined in response to official indicators that underscored worries about the country’s fragile recovery. The Shanghai Composite Index dropped by 0.31% and the blue-chip CSI 300 gave up 1.56% for the week. Hong Kong’s benchmark Hang Seng Index slumped by 4.15%. October’s economic data presented a mixed picture of China’s economy. The official manufacturing Purchasing Managers’ Index (PMI) surprised on the downside with a below-consensus 49.4 in November. It is lower than October’s 49.5, marking the second straight monthly contraction. The non-manufacturing PMI descended to a lower-than-expected 50.2 in November from 50.6 in October, but since the reading exceeded 50, growth remains expansionary albeit to a lesser degree. Another indicator, the private Caixin/S&P Global survey of manufacturing activity rose to a higher-than-forecasted 50.7 in November from 49.5 in October, as new order growth rose to the highest level since June. Furthermore, in Beijing’s latest effort to boost business confidence, Chinese authorities issued a 25-point plan to strengthen financial support for the private sector. The measures are geared towards unblocking financial channels such as loans, bonds, and equity financing.
The Week Ahead
This week, among the important economic data expected to be released, are the October JOLTS report, the November unemployment rate, and preliminary consumer sentiment for December.
Key Topics to Watch
- Factory orders for October
- S&P U.S. services PMI for November
- ISM services for November
- Job opening for October
- ADP employment for November
- U.S. productivity (revision) for Q3
- U.S. trade deficit for October
- Initial jobless claims (December 2)
- Wholesale inventories for October
- Consumer credit for October
- Consumer sentiment (prelim) for December
- U.S. unemployment report for November
- U.S. unemployment rate for November
- U.S. hourly wages for November
- Hourly wages year-over-year
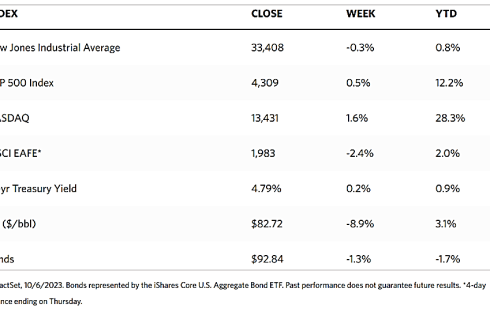
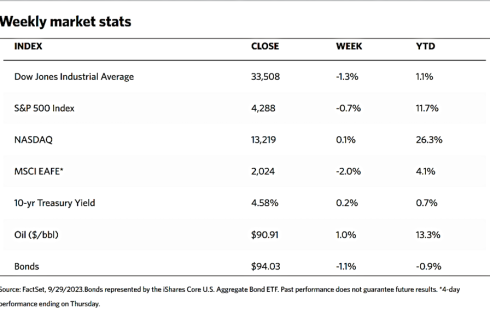
Markets Index Wrap-Up