
Weekly Market Review – July 15, 2023
Stock Markets
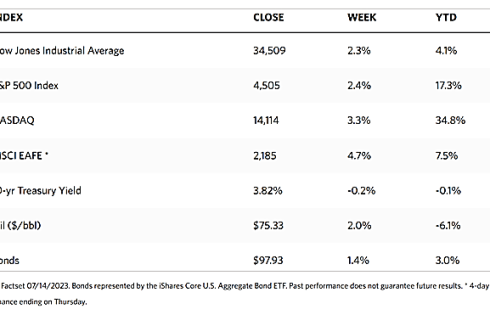
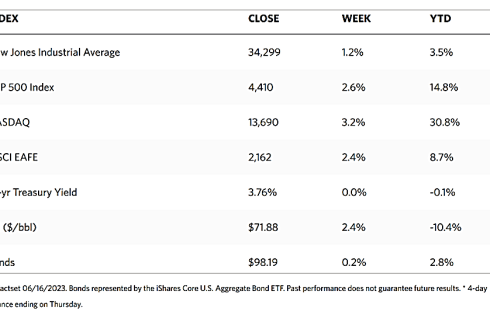
The equities market experienced a week of strong gains as investor confidence returned with data showing continued cooling inflation signals. The Dow Jones Industrial Average shot up by 2.29%. The S&P 500 Index surged by 2.42%, ending the week at 6.5% below the record intraday peak it set early last year. The Nasdaq Stock Market Composite jumped by 3.32% although it remained 12.94% below its all-time high. The NYSE Composite also climbed by 2.35%. Understandably, the CBOE Volatility Index, which measures investors’ risk perception, dipped by 10.05%. Outperformers within the S&P 500 were casino operators, regional banks, and asset managers. Underperformers included some of the major pharmaceutical firms and the defensive consumer staples sector. The official start of the earnings season was on Friday, with major banks reporting second-quarter results.
The major stimulus of last week’s rally was the release of consumer price index (CPI) inflation data on Wednesday. In June, both headline and core (i.e., food and energy prices excluded) inflation increased by only 0.2% which was slightly below expectations. The annual increase in headline inflation slowed to 3.0%, its lowest annual growth rate since March 2021. Core inflation also slowed to 4.8%, its slowest since October 2021. The Federal Reserve will still likely raise interest rates this month, but the sharp deceleration in both consumer and producer prices reported this week (albeit due largely to base effects) has weakened the rationale for further monetary tightening.
U.S. Economy
The inflation slowdown may be attributed several categories, mainly goods, housing, and services excluding housing. Goods inflation declined by 0.1% month-over-month even with a modest drop in used-vehicle prices. Optimism is spurred mainly by timely industry data which may bring used-car prices down even more. The Manheim Used Vehicle Value Index fell by 4.2% in June from the previous month and 10.3% from last year. The Index tends to lead the used-car price component of the CPI by two months and appears to be the biggest monthly drop since early in the pandemic. The huge drop in this key driver of core inflation suggests that there will be further easing in price pressures moving forward.
Regarding housing, it was once more the largest contributor to the increase in core CPI, however, the monthly increase in June was the smallest increase in rents since the end of 2021. We should expect housing inflation to continue to improve in the coming months, based on the historical lag between the time when inflation of newly signed rental contracts falls and the time it is reflected in the official data.
Finally, services excluding shelter (housing), a “supercore” measure highlighted by the Fed and which is largely a function of the labor market, continued to improve. This statistic, which is largely a function of the labor market, showed that the indicator fell to 4% in June, the smallest increase since December 2021. The reduction was largely due to a reduction in airfares, which in return was most likely driven by lower jet fuel prices, a phenomenon which probably will not be repeated. Despite this fact, it is noteworthy that services inflation continues to cool, despite unemployment treading close to its historic lows.
Metals and Mining
The weak inflation figures that were released this week pushed the gold market and other precious metals to their highest point in the last three consecutive weeks. Gold prices are holding solidly north of $1,950 per ounce. While investors are beginning to turn bullish, there is still sufficient reason to be cautious at these levels. The Federal Reserve’s monetary policies remain consistently restrictive despite both CPI and PPI showing some cooling and the rationale for further interest rate hikes begins to weaken. Consumer prices are up by 3.0% for the year, its lowest annual increase since March 2021, and core inflation rose 4.8% for the year in June. While inflation is headed in the right direction, it remains elevated and the Fed did announce more rate hikes are likely before the year is out. Should yields increase as a result, gold and other precious metals will stay bearish since they are assets that produce no yields.
This past week, the spot prices of precious metals jumped higher. Gold, which began at $1,925.05, landed at $1,955.21 per troy ounce, up by 1.57% for the week. Silver ended the week at $24.95 per troy ounce, gaining 8.06% from its closing price last week at $23.09. Platinum gained 6.83% this week over last week’s closing price of $913.87, ending at $976.25 per troy ounce. Palladium, which ended one week ago at $1,250.11, closed this week at $1,277.84 per troy ounce, up by 2.22%. The three-month LME price of base metals also trekked higher. Copper ended this week at $8,673.50 per metric ton, 4.99% higher than its previous week’s close at $8,261.50. Zinc ended this week at $2,439.00 per metric ton, 3.19% higher than last week’s closing price of $2,363.50. Aluminum closed this week at $2,276.50 per metric ton for a gain of 6.93% from last week’s closing price of $2,129.00. Tin ended this week at $28,809.00 per metric ton, up slightly by 0.98% over last week’s closing price of $28,530.00.
Energy and Oil
Oil prices this week were boosted by news of a market drop in U.S. inflation growth. ICE Brent prices were pushed above the $80 per barrel level for the first time since May. Additionally, backwardation is steepening again due to Russia’s export curbs, and Saudi Arabia’s production cuts this week are one more creating more tightness in the oil supply. In its latest Oil Market Report, the OPEC forecasted demand growth in 2024 to be 2.25 million barrels per day (b/d). This figure is only slightly lower than its revised figure for 2023 at 2.44 million b/d, double that of the International Energy Agency. The oil market is therefore set to experience its largest gain in months, likely discounting the bigger-than-expected build in U.S. crude inventories.
Natural Gas
In the first six months of 2023, natural gas deliveries by pipeline to U.S. liquefied natural gas (LNG) export facilities (LNG feed gas) averaged 12.8 billion cubic feet per day (Bcf/d). This was more than the 2022 annual average by 1.0 Bcf/d (8%), and 0.5 Bcf/d (4%) more than the first six months of 2022. Mild winter temperatures and above-average storage inventories in the northern hemisphere decreased spot LNG prices so far this year, which may provide an incentive to increase LNG importation, particularly in the relatively more price-sensitive Southeast Asian countries.
For this report week from Wednesday, July 5, to Wednesday, July 12, 2023, the Henry Hub spot price fell by $0.09 from $2.64 per million British thermal units (MMBtu) to $2.55/MMBtu. The price of the August 2023 NYMEX contract decreased by $0.025, from $2.657/MMBtu at the start of the week to $2.632/MMBtu at the week’s end. The price of the 12-month strip averaging August 2023 through July 2024 futures contracts declined by $0.028 to $3.181/MMBtu.
International natural gas futures prices declined for this report week. The weekly average front-month futures prices for LNG cargoes in East Asia dipped by $0.09 to a weekly average of $12.04/MMBtu. Natural gas futures for delivery at the Title Transfer Facility (TTF) in the Netherlands, the most liquid natural gas market in Europe, decreased by $1.43 to a weekly average of $9.78/MMBtu. In the corresponding week last year (the week from July 6 to July 13, 2022), the prices were $39.13/MMBtu and $51.88/MMBtu in East Asia and at the TTF, respectively. For August-October as of July 12, forward prices were higher in East Asia compared with the TTF.
World Markets
Taking their cue from the U.S., stock exchanges in Europe surged during the week. The pan-European STOXX Europe 600 Index closed the week higher by 2.95%, its biggest weekly gain in the past three-and-a-half months. Signs of cooling inflation in the U.S. were perceived by European investors as a sign that interest rates are close to their peak. Europe also gained optimism on news that China extended support measures to its property sector, thus increasing expectations that additional economic stimulus may be forthcoming. European stock indexes advanced, with France’s CAC 40 Index surging ahead by 3.69%, Germany’s DAX gaining by 3.22%, and Italy’s FTSE MIB climbing by 3.19%. The UK’s FTSE Index 100 added 2.45%. The slowing U.S. inflation measures suggested that the Fed is close to ending its policy-tightening cycle. In response, European government bond yields fell and UK bond yield likewise slid, although robust wage data seemed to have slowed the descent. Also, the minutes of the European Central Bank’s (ECB) June meeting showed support for additional rate increases to stave off persistently high inflation in the region.
The Japanese stock markets bucked the trend of their Asian counterparts, failing to take advantage of a regional rally spurred by positive developments in China. The Nikkei 225 Index moved sideways while the broader TOPIX Index slid by 0.73%. There was upward pressure on Japan’s domestic yields as expectations grew that the Bank of Japan (BoJ) could adjust its yield curve control framework as soon as its July 27-28 meeting. The last instance of such an adjustment was made in December 2022. The yield on the 10-year Japanese government bond (JGB) ascended to 0.47% from what was previously 0.44%, inching closer to the 5.0% level at which the BoJ caps JBG yields. The yen firmed up to about JPY 138 against the U.S. dollar, from around JPY 142 the previous week, in anticipation of monetary policy normalization and the possibility that the BoJ may raise its inflation outlooks for this fiscal year in July. On the other hand, the dollar struggled as U.S. producer prices grew by less than expected in June. This was seen by investors as a heightened possibility that the U.S. Fed may soon halt rate increases.
Chinese stocks rallied after Beijing signaled that it will be adopting measures to support the country’s struggling economy. The Shanghai Stock Exchange Index climbed by 1.29% and the blue-chip CSI 300 gained by 1.92%. Hong Kong’s benchmark Hang Seng Index shot up by 5.71%. Government officials announced that it would extend two of the 16-point stimulus guidelines that were rolled out in November 2022 to support the flailing property sector. The extended policies involved deferring property development loans and encourage financial institutions to ensure the delivery of projects. The extended guidelines will be in effect until the end of 2024. On the economy, China’s CPI is unchanged in June from a year earlier. This is the weakest reading of the indicator since February 2021. Core inflation (excluding volatile food and energy prices) dipped to 0.4% from 0.6% the previous month. The PPI descended to 5.4% which was lower than expected, the ninth consecutive month that the indicator declined. The data suggests that China’s economy may succumb to increasing deflation risks, providing more evidence of the Country’s weakening post-lockdown recovery.
The Week Ahead
Some of the important economic data scheduled to be released this week include housing market data, June retail sales, and leading economic indicators.
Key Topics to Watch
- Empire State manufacturing survey
- U.S. retail sales
- Retail sales minus autos
- Industrial production
- Capacity utilization
- Business inventories
- Home builder confidence index
- Housing starts
- Initial jobless claims
- Philadelphia Fed manufacturing survey
- Existing home sales
- U.S. leading economic indicators
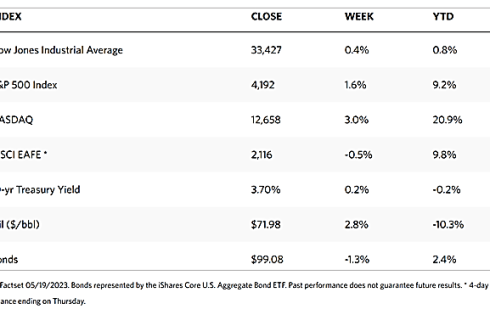
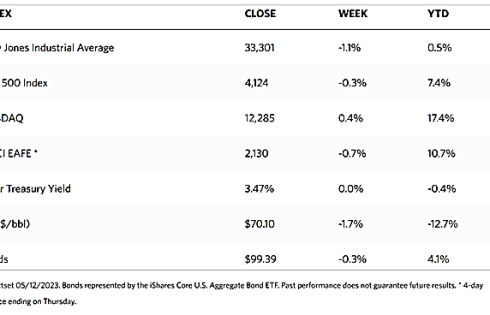
Markets Index Wrap Up