
Stock Markets
As has been the dominant strategy throughout 2021, investors acted according to the “buy the dip” mentality last week. The market pulled back by 5% for the first time during September’s trading, and now appears to have regained its momentum by responding vigorously to last week’s strong start to the corporate earnings season. 2021 began with a positive outlook which the market proved well justified. Despite this fact, nothing appears to have gone as predicted. Yet, the solid economic signals and positive earnings reports that came out during the week fueled the second consecutive weekly gain. The S&P MidCap 500 Index performed robustly and tentatively approached 0.1% of its all-time intraday high on the last day of trading. The small real estate sector outperformed the other sectors within the S&P 500 Index, during which long-term bonds slid. Consumer discretionary shares rose on Tesla’s lead, while communication shares services shares were weighed down by sell-offs in shares of traditional media providers.
U.S. Economy
The retail sales report for September showed that retail spending rose by 14.3% year-on-year. Historically this is remarkably robust and shows that the economy is poised to consider its recovery. Simultaneously, this is the slowest growth rate since March and only half of the percentage increase in May, possibly due to the slowdown in consumption as a result of the delta-variant spread.
In the labor market, last week’s initial jobless claims slid to 293,000, the first time this indicator fell below 300,000 since March of last year. Viewing the indicators in their broader context, the initial claims peaked at an astounding 6.15 million at the start of April with the unemployment rate was slightly below 15%. Since declining initial claims is a leading indicator of favorable employment conditions, this unemployment rate is an encouraging data point. Unemployment currently stands at 4.8%, which is a considerable improvement from the 6.7% unemployment rate with which 2021 started. For the year so far, the job growth has been more sluggish than had been expected initially, as highlighted by the disappointing gains in the past months. On the other hand, wage growth has been substantial than anticipated as they have risen to the highest levels in the last ten years.
Concerning the Federal Reserve monetary policy, the incoming inflation data continues to justify a possible tapering policy on bond-buying by the Fed. Last week also brought to investors’ attention the possibility of a potential shift in the Fed’s leadership in light of Chairman Powell’s end-of-term in February 2022. Powell will likely be renominated by President Biden for purposes of continuity as well as Powell’s lenient monetary approach despite the increasing inflationary trend.
Metals and Mining
The trading pattern for gold caused excitement among analysts the past week who saw the surge in the inflation rate as a game-changer for gold. It was therefore unexpected that the price of the precious metal tumbled by nearly $30 on Friday, subsequent to the release of strong U.S. retail sales numbers. The rally that began the week stemmed from the International Monetary Fund’s downgrading of its global growth forecast from 6% to 5.9%. Reasons cited were risks from supply chain bottlenecks, price pressures, and threats from the delta variant. For the U.S. the 2021 growth forecast was reduced from 7% to 6% on the back of supply constraints. Inflation is likely not only temporary since central banks will be unable to mitigate price surges without imposing stringent measures that will hurt the economy. Friday’s selloff was a reaction to the technical resistance at $1,800 per ounce. A bullish sentiment for gold is likely to prevail in the future due to the escalation of geopolitical tensions.
After the selldown, gold still ended up 0.6% for the week, closing the week with $1,767.62 per troy ounce from $1,757.13 per troy ounce the week before. Silver gained 2.78%, closing at $23.31 per troy ounce from $22.68. Platinum rose 2.92%, from $1,028.59 to $1,058.64 per troy ounce. Palladium ended only slightly down by 0.05%, closing $2.078.21 per troy ounce from $2,079.17. All the base metals were up. Copper closed 9.83% up, from $9,361 per metric tonne to $10.281. Aluminum was also up by 6.93% from $2,966 to $3,171.50 per metric tonne. Tin gained by 2.89% from $36,156 to $37,200 per metric tonne. Outperforming among the base metals was zinc, which rose 20.42% week-on-week from $3,151.00 to $3,171.50 per metric tonne week-on-week.
Energy and Oil
The rally in natural gas prices proceeded to push the switch from gas to products and continues to push oil prices further upwards. A counter-seasonal mini-renaissance of HSFO utilization prevails in Asia. Simultaneously, the demand for crude remains robust as a week-on-week decline in OECD stockpiles is observed. Weakening Chinese imports placed added pressure on oil prices on Thursday, offset by a bullish sentiment that renewed buying interest on Friday. Meanwhile, the European Union intends to ban oil, gas, and oil exploration in the Arctic. This region is seen to be the most impacted geographical area by climate change, having warmed three times as fast as the global average over the past half-century. None of the EU members, however, have a significant footprint in the Arctic.
Natural Gas
At most locations during the report week (October 6 to October 13), natural gas spot prices fell. The Henry Hub spot price came down from $5.95 per million British thermal units (MMBtu) at the start of the week to $5.45/MMBtu by the week’s end. Forecasts have natural gas spot prices at the U.S. benchmark Henry Hub at an average of $5.67/MMBtu from October 2021 to March 2022. This represents the highest winter price since 2007-08. As production growth outpaced LNG exports growth, the Henry Hub prices is expected to decrease early next year, to average $4.01/MMBtu. Over the week, 16 LNG vessels with a combined LNG-carrying carrying capacity of 50 billion cubic feet (Bcf) left the U.S. between October 7 to October 13,
World Markets
European shares surged as optimism greeted the likelihood of continued economic recovery and strong corporate earnings. The pan-European STOXX Europe 600 Index gained 2.65%. The major European indexes were mostly higher. France’s CAC 40 Index surged by 2.55%, Germany’s Xetra DAX Index climbed 2.51%, and Italy’s FTSE MIB Index rose by 1.68%. The UK’s FTSE 100 Index advanced 1.95%. The core eurozone bonds ended the week of volatile trading down. Yields moved higher due to concerns of inflation pressures, although high-quality government bonds were met with higher demand by the week’s end. Investors feared that the central banks would make the mistake of raising interest rates and adopting more restrictive monetary policies too aggressively. Peripheral eurozone bond yields as well as the UK gilt yields followed the direction taken by the core markets. Due to supply chain bottlenecks and slowing global trade, Eurostat data showed that industrial production fell in the Eurozone in August.
In Japan, the stock market returns remained in positive territory despite the dissolution of Japan’s powerful lower house of parliament. This move set the stage for a general election on October 31, and reassured investors that the new Prime Minister Fumio Kishida will continue to follow the policies of his predecessors. There will likely be no increase in the country’s capital gain tax, a possibility of which initially caused some nervousness among investors. The Nikkei 225 Index advanced 3.64% and the broader TOPIX Index rose 3.16%. The yen descended to JPY 114.3 against the dollar, its lowest level in three years. The drop prompted Finance Minister Shunichi Suzuki to declare the importance of currency stability, sending signals that the government will closely monitor the currency market and its economic impacts. The yield on the 10-year Japanese government bond remained unchanged at 0.08%.
The Chinese market moved sideways ahead of the quarterly GDP report due to be released next week. The large-cap CSI 300 Index inched slightly up by 0.3% while the Shanghai Composite Index slid by 0.6%. Premier Li Keqiang announced ahead of Monday’s GDP release that China’s third-quarter economic expansion slowed down; however, he did not elaborate further. Investors have been generally concerned about the worsening energy crisis in the country as heightened energy demand is expected to meet with the power supply shortage during the coming cold months. Fuel prices are further escalating as power plants scramble to stock up on coal. Energy importers are likewise worried about the rising oil and natural gas prices which have risen to their highest level in years. Many Chinese energy companies are in advanced negotiations with U.S. exporters to recure long-tern LNG supplies. Natural gas prices have surged more than fivefold in Asia this years, further driving the anticipation of power shortages in the coming winter.
The Week Ahead
The LEI index, Industrial Production, and PMI index are among the important economic data being released in the coming week.
Key Topics to Watch
- Industrial production
- Capacity utilization rate
- National Association of Home Builders index
- Building permits (SAAR)
- Housing starts (SAAR)
- Beige Book
- Initial jobless claims (regular state program)
- Continuing jobless claims (regular state program)
- Philadelphia Fed manufacturing index
- Existing home sales (SAAR)
- Leading economic indicators
- Markit manufacturing PMI (flash)
- Markit services PMI (flash)
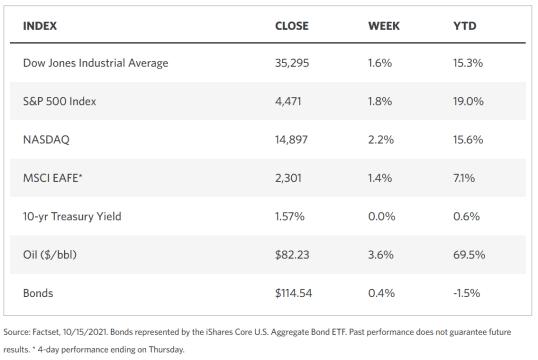
Markets Index Wrap Up