
Stock Markets
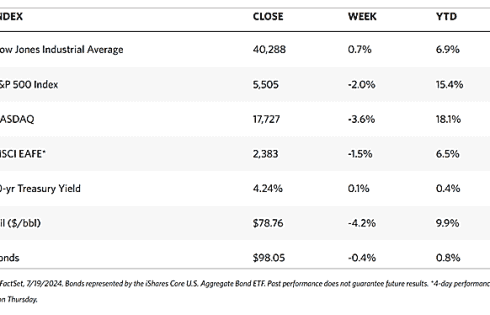
The major stock market indexes ended mixed for the week. The 30-stock Dow Jones Industrial Average (DJIA) rose by 0.72% while the DJ Total Stock Market fell by 1.68%. The broad S&P 500 Index likewise lost by 1.97% and the technology-heavy Nasdaq Stock Market Composite plunged by 3.65%. Mid-caps lost ground while small-caps gained. The NYSE Composite dipped by 0.54%. The CBOE Volatility Index (VIX), the indicator for investor risk perception, climbed by 32.58%.\
The week’s trading saw a continued rotation in market leadership to value shares and small-caps. The DJIA outperformed due to it being narrowly focused and comprised more of value stocks. The Nasdaq underperformed as it consists more of growth stocks in the technology sector. Late this week was also made memorable by the widespread global disruption of IT systems caused by an error in a vendor’s security update to major users of the Microsoft operating system. Although flights, banking services, and other institutions were disrupted, the financial markets were hardly impacted.
The underperformance of growth stocks was affected by a sharp decline in chip stocks on Wednesday. News emerged that the Biden administration informed allies that it was considering curbing exports sharply if companies in their jurisdictions continued providing China with access to advanced semiconductor technology. Two of the companies alluded to were Tokyo Electron and ASML of the Netherlands. Stock prices of Taiwan Semiconductor Manufacturing, Broadcom, and NVIDIA (the third-largest company by market capitalization) plunged on the news.
U.S. Economy
Economic data released during the week generally surprised on the upside. Excluding volatile gas and auto segments, retail sales shot up by 0.8% in June, the most since January 2023 and well above the consensus estimate. Building permits also rose by more than expected, jumping by 3.4% in June. The Federal Reserve also reported on Wednesday the increase in industrial production by 0.6% in June, roughly twice the estimates. The Philadelphia Fed announced that its gauge of current regional business conditions surged to its highest in three years.
The outlier was the Labor Department’s report of weekly jobless claims, which indicated that the number of Americans filing for unemployment increasing to 243,000. The figure rebounded to the nine-month high that it set for the week ended June 8. A 20,000 increase in continuing claims to 1,867,000, the highest number since November 2021, appears to be of greater concern.
Metals and Mining
The political climate in the US is heating up as November elections draw near. After the assassination attempt on Republican Party nominee Donald Trump one week ago and turmoil within the opposing Democrat party, analysts believe that his chances of reclaiming the presidency have greatly increased. This has prompted experts such as Thorsten Polleit, Honorary Professor of Economics at the University of Bayreuth, to forecast that gold prices are poised to rise, possibly by 10% to 15%, by this time next year. Currency and commodity analyst Arslan Ali at FX Empire noted that Trump’s policy stance may be potentially inflationary, weakening the dollar and enhancing the attraction of gold as a safe-haven asset. In any case, investors expect a 90% chance that the Federal Reserve will cut interest rates in September creating tailwinds for gold.
Spot prices of precious metals are down for the week. Gold closed at $2,400.83 per troy ounce, 0.44% lower than its close last week at $2,411.43. Silver ended at $29.22 per troy ounce, 5.10% below last week’s close at $30.79. Platinum settled at $965.95 per troy ounce, 3.78% below its close last week at $1,003.92. Palladium last traded at $910.05 per troy ounce, 6.35% down from its closing price last week of $971.77. The three-month LME prices of industrial metals also ended lower for the week. Copper came from $9,786.50 last week to end at $9,386.00 per metric ton this week for a 4.09% loss. Aluminum slid from its close last week at $2,476.50 to its close this week at $2,385.00 per metric ton, coming down by 3.69%. Zinc, which ended last week at $2,959.00, closed this week at $2,809.00 per metric ton, a loss of 5.07%. Tin, which closed last week at $34,666.00, ended this week at $31,604.00 per metric ton for a loss of 8.83%.
Energy and Oil
Disappointment in China’s outlook has offset the consistent stream of positive news for oil from the United States despite the largely unexpected 5-million-barrel drop in US crude stocks. Hardly any tangible pledges were seen by the Third Plenum of China’s Central Committee, with the lack of constructive takeaways across commodities. Meanwhile, shrinking stocks in the delivery point of WTI in Cushing fell to their lowest reading in three months, and the premium of front-month US crude futures over the M2 contract widened to its highest since October 2023, as high as $1.60 per barrel. Furthermore, the global IT outage disrupted Friday trading, prompting ICE Brent to close the week at around $85 per barrel.
Natural Gas
For the report week from Wednesday, July 10 to Wednesday, July 17, 2024, the Henry Hub spot price fell by $0.39 from $2.37 per million British thermal units (MMBtu) to $1.98/MMBtu. The last time the Henry Hub price fell below $2.00/MMBtu in July was in 2020 during the COVID-19 pandemic. Regarding Henry Hub futures, the price of the August 2024 NYMEX contract decreased by $0.294, from $2.329/MMBtu at the beginning of the report week to $2.035/MMBtu at the week’s end. The price of the 12-month strip averaging August 2024 through July 2025 futures contracts declined by $0.175 to $2.827/MMBtu.
International natural gas futures price changes were mixed this week. The weekly average front-month futures prices of LNG cargoes in East Asia decreased by $0.12 to a weekly average of $12.28/MMBtu. Natural gas futures for delivery at the Title Transfer Facility (TTF) in the Netherlands, the most liquid natural gas market in Europe, increased by $0.04 to a weekly average of $10.16/MMBtu. In the week last year corresponding to this report week (beginning July 12 and ending July 19, 2023), the prices were $11.22/MMBtu in East Asia and $8.67/MMBtu at the TTF.
World Markets
European stocks lost some ground this week as the pan-European STOXX Europe 600 Index closed 2.68% lower in local currency terms amid rising trade tensions between China and the U.S. The major indexes in the Continent were also down. Italy’s FTSE MIB lost by 1.05%, France’s CAC 40 Index fell by 2.46%, and Germany’s DAX declined by 3.07%. The UK’s FTSE 100 Index gave back 1.18%. While the European Central Bank (ECB) was expected to reduce interest rates this second half of 2024, it has not yet happened as the central bank kept their rates unchanged at 3.75%. The ECB clarified that it will not commit to any rate path and will base its decisions on economic data. ECB President Christine Lagarde that a move in September is “wide open” and that risks to economic growth were “tilted to the downside.” Industrial production in the euro area dropped in May by 0.6% sequentially, for the first time since January. Output dropped by 2.9% year-over-year, with the steepest declines registered in Germany, Italy, and France. In the UK, average earnings, excluding bonuses, grew by an annual 5.7% in the three months to May, remaining close to double the headline annual inflation which holds steady at 2% in June. The jobs market remains strong, sparking doubts that the Fed will announce a rate cut in August.
Japan stocks fell over the week. The Nikkei 225 Index lost by 2.7% while the broader TOPIX Index declined by 1.2%. Rising concerns about tighter U.S. restrictions on exporters of advanced semiconductor technology to China (including several Japanese chipmakers), weighed on technology stocks. The yield on the 10-year Japanese government bond dropped to 1.04%, from 1.06% at the end of the previous week, amid speculation about whether the Bank of Japan (BoJ) would hike interest rates at its meeting scheduled for July 30-31. The yen strengthened to about JPY 157.37 against the greenback, from JPY 157.91 during the previous week. The yen’s second successive weekly gain came after what is suspected to be recent yen-buying operations by the government. On the Japanese economy, inflation ticked up as the closely monitored core consumer price index (CPI) rose by 2.6% year-over-year in June, up from 2.5% year-on-year in May, but still short of a consensus estimate of 2,7%. The country’s economic fragility was underscored by the government reducing its gross domestic product growth forecast for the current fiscal year ending March 2025 to a 0.9% expansion, from a projected gain of 1.3% in January. The downgrade is largely due to sluggish domestic demand amid rising import costs resulting from the yen’s weakness, which in turn erodes the purchasing power of households.
China’s equities market climbed as investor sentiment was largely unmoved by weaker-than-anticipated economic growth in the second quarter. The Shanghai Composite Index rose by 0.37% for the week while the blue-chip CSI 300 advanced by 1.92%. Hong Kong’s benchmark Hang Seng Index fell back by 4.79%. The country’s gross domestic product grew slower than expected at 4.7% in the second quarter year-on-year, slowing down from the first quarter’s 5.3% growth. The economy grew by 0.7% on a quarterly basis, which is less than half of the first quarter’s revised 1.5% expansion. The weakness in the economy was highlighted by other data. Year-on-year retail sales grew by 2%, which is slower than forecasted, and slower than the 3.7% increase in May. This was partly due to lower sales of autos and household appliances. A bright light is that industrial production rose by a better-than-expected 5.3% in June from one year ago, but it was slower than May’s 5.6% rise. China’s new home prices dipped by 0.7% in June, the same as May’s 0.7% drop and extending losses for the 12th consecutive month. The data suggests that the major property rescue package rolled out by Beijing in May had little impact in turning around the property market slump that has become the greatest hindrance to China’s economic recovery.
The Week Ahead
The second quarter GDP and PCE inflation data for June are among the important economic data scheduled for release in the coming week.
Key Topics to Watch
- Existing home sales for June
- New home sales for June
- GDP for Q2
- Initial jobless claims for July 20
- Durable-goods orders for June
- Durable-goods minus transportation for June
- Advanced U.S. trade balance in goods for June
- Advanced retail inventories for June
- Advanced wholesale inventories for June
- Personal income (nominal) for June
- Personal spending (nominal) for June
- PCE index for June
- PCE (year-over-year)
- Core PCE index for June
- Core PCE (year-over-year)
- Consumer sentiment (final) for July
Markets Index Wrap-Up