

S&P 500 falls to fresh lows, but RSI holds above oversold threshold
The S&P 500 index’s continued selloff into the first correction in two years now comes with a silver lining — bullish technical divergence.
The S&P 500 index SPX, -1.84% sank 1.8% on Wednesday to close at an eight-month low of 4,225.50, a day after it closed more than 10% below its Jan. 3 record close for the first time.
Many on Wall Street define a decline of 10% or more from a bull-market peak as a correction, with a decline of at least 20% viewed as a bear market. The last time the S&P 500 entered a correction was February 2020, which eventually led to the first bear market since the financial crisis of 2008-09.
If there is a bright side to the S&P 500’s new low, it’s that the Relative Strength Index (RSI), a momentum indicator that measures the magnitude of recent gains against the magnitude of recent declines, is still above its January low.
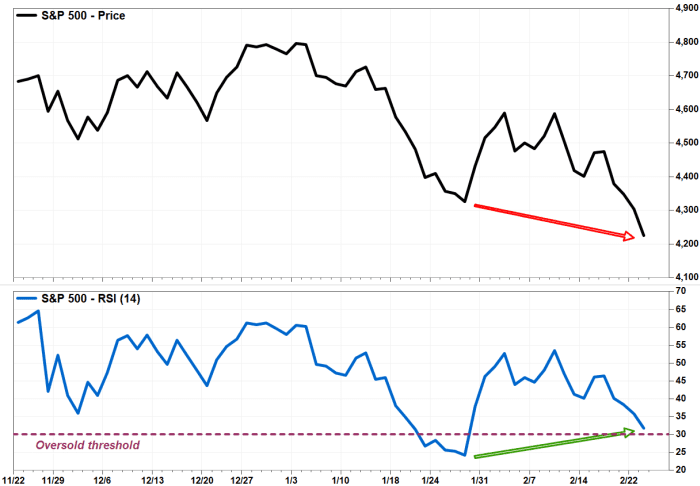
This pattern, in which prices make new lows but underlying technicals make higher lows is referred to as “bullish divergence,” and suggests the downtrend may be running out of steam.
Another positive sign from the RSI indicator is that it remains above what many chart watchers view as the oversold threshold of 30.
When the RSI hit a low of around 24.1 on Jan. 27, the lowest reading since February 2020, on the same day the S&P 500 fell to a 3 1/2-month low, it suggested a short-term bounce was due. And on cue, the S&P 500 kicked off a four-day win streak in which it ran up 6.1%, before eventually resuming its downtrend.
Many technicians also believe that the ability of a selloff to produce an oversold reading is actually a confirmation of a downtrend’s strength.
There’s a saying on Wall Street, as noted last month when the Dow Jones Industrial Average’s DJIA, -1.38% RSI produced the most oversold reading in two years, that oversold doesn’t mean over.
The key to reading RSI is to watch for divergences. When the RSI trends in the opposite direction of prices, the price tends to eventually move in the direction of RSI.
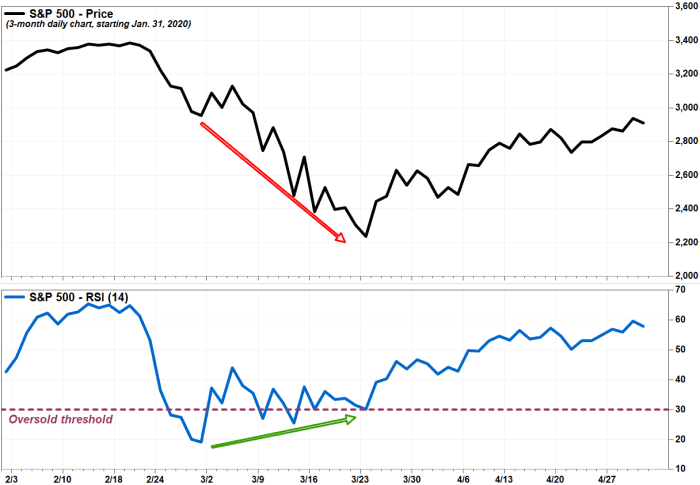
The only problem for investors is that technical divergences aren’t good timing tools, as they can last for weeks before prices bottom, if they do at all. As the above chart shows, after the RSI bottomed, the S&P 500 fell another 24% over three weeks before prices bottomed.
So before turning bullish, no matter what RSI is doing, prices still matter the most. “The index will need to start moving higher to confirm these divergences,” wrote Mark Arbeter, president of Arbeter Investments LLC, in a note to clients.