

Another drop below the 200-DMA and relative-strength breakdown are bad technical signs
A chart of Microsoft Corp.’s stock will soon flash a clearly visible bearish signal that’s been in the works for the past couple months — but there are some other, more subtle technical signs that may be even more worrisome for bulls.
The first obvious problem with the software giant’s MSFT1.26% stock chart is the looming “death cross” pattern that could appear as soon as the next couple sessions.
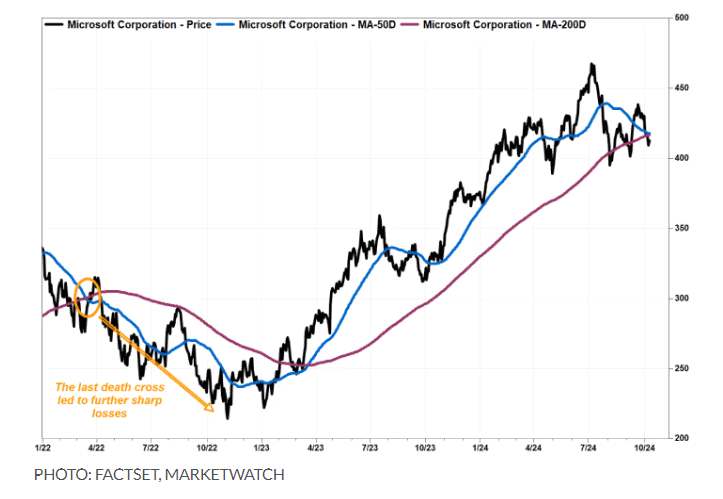
A death cross refers to when the 50-day moving average crosses below the 200-day moving average. It’s thought to mark the spot where a shorter-term pullback graduates to a longer-term downtrend.
The 50-DMA for Microsoft’s stock extended to $417.91 in Tuesday trading, according to FactSet, down from $418.17 on Monday, while the 200-DMA rose to $417, from $416.78. At those trajectories, a death cross should materialize as early as Thursday
But since these patterns are well telegraphed — Microsoft’s 50-DMA had peaked in late July — and can put a pullback in historical perspective, they shouldn’t be viewed as triggers to make a trade.
The last death cross appeared in mid-March 2022, after a 16% selloff in four months, and stock the fell another 45% before bottoming a year later.
But the two before that appeared either just days after or before the stock bottomed, and the 50-DMA crossed back above the 200-DMA within two months in each case.
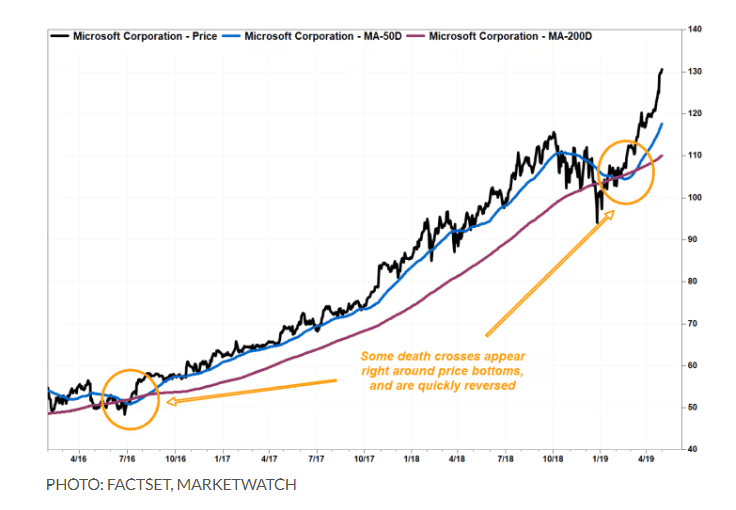
So while a death cross would suggest the current pullback — the stock is basically trading on Tuesday where it was about seven months ago — is not like the others over the past couple years that were quickly reversed, bulls shouldn’t necessarily sell just because one appears.
There are actually a couple chart patterns that have already developed that may be cause for greater concern.
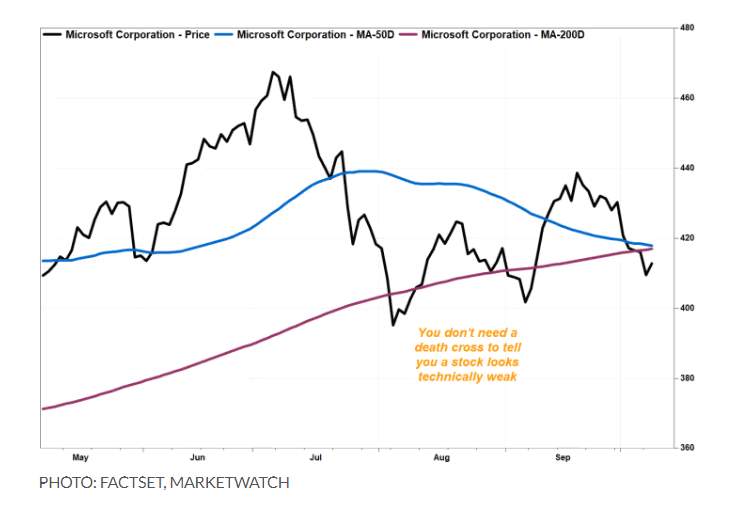
BTIG technical analyst Jonathan Krinsky said that he doesn’t typically use death crosses to gauge a stock’s technical health, but he does look at the moving averages that are used to define them.
For Microsoft’s stock, the fact that the 50-DMA is falling, and that it’s trading below the 200-DMA for the third time in as many months, “is clearly not a great sign,” according to Krinsky.
More worrisome for him is how Microsoft’s stock “continues to trade poorly relative to the market.”
To see that relationship, chart watchers use a relative-strength chart, which compares a stock’s movement with an index, like the S&P 500 SPX0.97%, rather than just tracking the stock’s price.
Microsoft’s stock still looks technically “OK” on a price chart, as it is trading well above the closing lows seen in August and April.
But a relative-strength basis, the stock relative to the S&P 500 has recently broken below a year-long upward channel, as well as a couple of key support levels.
And it has dropped to the lowest levels seen since August 2023.
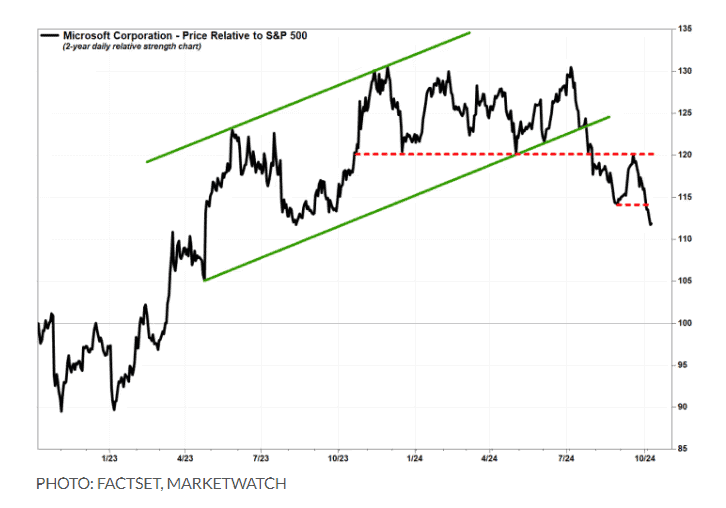
“In absolute terms, it remains OK above $400, but the one-year relative low is not a great sign,” Krinsky wrote in a recent note to clients.
Microsoft shares have dropped 11.4% over the past three months, while the S&P 500 has gained 3%.