
Stock Markets
Since the markets hit an all-time high on the first trading day of the year, the benchmark indexes have been on a steady decline and hit a new one-year low in the past week. The financial markets around the world are contending with an environment defined by rising inflation, tightening monetary policies, and growing political risks. Investors locally are growing increasingly doubtful that the Federal Reserve will be able to tame inflation without causing a recession and thereby achieve a “soft landing” for the economy. The Cboe Volatility Index, which is an indicator of the market’s expectation of higher forward-looking returns, remains elevated but below its May 2 intraday high. Exchange-traded funds achieved higher volumes, indicating higher hedging activity levels. Investors are growing increasingly risk-averse, and the strong risk-off environment is evident in the plunge in the value of many cryptocurrencies.
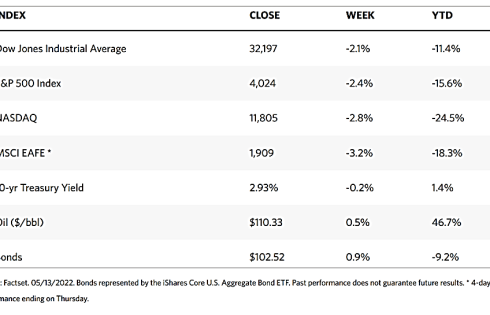
Last week marked the sixth consecutive weekly decline for both the Nasdaq Composite and the S&P 500 Index and the seventh for the Dow Jones Industrial Average (DJIA). The S&P 500 descended to almost 18% off of its peak at its low point on Thursday. This level confirms that the market is well into correction, and is only 2% above the performance threshold of a bear market (i.e., -20%). The benchmark indexes recovered somewhat their losses by Friday, on the back of a rally in Tesla shares when CEO Elon Musk announced that his deal to buy Twitter was “on hold.” This purchase is going to be partly funded by a sale of a portion of Musk’s considerable stake in the electric car manufacturer.
U.S. Economy
Inflationary pressures continue to remain one of the fundamental concerns that moved this week’s markets, and it is possible but still uncertain that inflation has peaked. The Fed is currently hiking interest rates at the fastest pace in twenty years, to soften the landing. The central bank is intent on raising borrowing costs sufficiently to slow growth to tame inflation, but not to push the economy into a recession. There may be a need to encounter several months of moderating inflation before the monetary policy may comfortably ease restrictions. Protracted periods of moderating inflation may be the principal catalyst to stabilize bond yields and rally equities.
The present economic data shows that there is a chance for slowing but continued economic growth. If this resiliency can be maintained, then economic contraction in the form of a recession may be averted. Currently, several indicators are showing this. The manufacturing and services Purchasing Managers’ Indexes (PMIs) have shown that they are still expanding, there is still positive momentum in the labor market, and despite the sharply tightening financial conditions, credit continues to flow to the real economy. Corporate profit margins have likely peaked, but the benchmark S&P 500 earnings are still expected to expand by 9% over the 50% increase last year. As the economy slows, these estimates can be expected to be revised lower, earnings growth can still be expected to remain positive for 2022 and 2023.
Metals and Mining
The price of gold has dropped by 4% this past week, the worst selloff experienced for this precious metal in the last year. Gold is now at its lowest level in three months after four consecutive weekly losses, and with the continued pessimism in the market, it may struggle to hold its price above the $1,800 per ounce support level. The price of precious metals is not responding as it normally does to the disappointing economic news: U.S. consumer price index (CPI) shows annual inflation rose by 8.3% in April, gasoline prices are hitting record highs, consumer sentiment is at its lowest in 11 years, and equities are sinking. These indicators would have traditionally sent gold higher as a flight-to-safety asset; instead, gold continues to descend. The explanation may be traced to the rising U.S. dollar and bond yields due to the restrictive policies adopted by the Fed. Attractive bond yields attract investor interest away from non-yielding assets such as precious metals.
In the past week, gold lost 3.92% from its previous close at $1,883.81 to its recent close at $1,811.79 per troy ounce. Silver, which began the week at $22.36 and ended at $21.11 per troy ounce, descended by 5.59%. Platinum ended the week before at $962.24 and this week at $946.30 per troy ounce, shedding off 1.66%. Palladium, which previously ended at $2,051.92 and closed this week at $1,946.30 per troy ounce, lost 5.15%. Even the 3-month price of base metals followed the direction of the precious metals. Copper went from $9,414.50 to $9,159.00 per metric tonne for the week, down by 2.71%. Zinc slid from $3,772.00 to $3,489.50, per metric tonne for a loss of 7.49% of its value. Aluminum, which previously closed at $2,842.00, ended the week at $2,788.00 per metric tonne, down slightly by 1.90%. Tin lost 15.18% week-on-week, from $39,340.00 to this week’s $33,370.00 per metric tonne.
Energy and Oil
The news of the week for oil markets is the falling demand as several reports indicate slashing demand forecasts for the remainder of 2022. The key factors driving this prediction are the soaring inflationary pressures and supply chain disruptions which are expected to take their toll. Most notable of the revised forecasts are those released by the International Energy Agency (IEA) and the Organization of Petroleum Exporting Countries (OPEC). There have been no further developments regarding the European Union’s (EU’s) oil ban on Russia nor China’s Covid lockdown measures which are projected to significantly impact supply-demand scenarios if ever they materialize. While these uncertainties continue, volatility in oil prices is expected to prevail. Meanwhile, chances for a successful Iran Nuclear Deal are fading as the U.S. Congress expresses strong opposition to the idea of lifting sanctions on the Iran Revolutionary Guard (IRGC).
Natural Gas
At most locations this report week (May 4 to May 11), natural gas spot prices fell. The Henry Hub spot price slid from $8.30 per million British thermal units (MMBtu) to $7.51/MMBtu within the week. International spot prices for natural gas also fell for the week, for both the Title Transfer Facility (TTF), the most liquid natural gas spot market in Europe, and the East Asia market. In the U.S. domestic market, prices along the Gulf Coast fell despite the rise in both temperatures and demand for air conditioning. Prices in the Midwest followed the same direction, as well as prices along the West which were consistent with the national average. In the Northeast, prices declined due to less heating demand. The U.S. natural gas supply increased week-over-week and demand for natural gas fell in line with moderate temperatures across many major metropolitan areas. Exports of U.S. LNG decreased by four vessels this week from the week before.
World Markets
European shares exhibited early weakness but later rebounded to end the week higher, even though inflationary pressures, increasingly restrictive monetary policies, and an increasingly pessimistic economic outlook continued to prevail. The pan-European STOXX Europe 600 Index closed 0.83% higher in local currency terms. The major stock indexes followed this lead, with Germany’s Xetra DAX Index advancing 2.59%, Italy’s FTSE MIB Index adding 2.44%, and France’s CAC 40 Index climbing 1.67%. The UK’s FTSE 100 Index gained 0.41%. Core eurozone government bond yields decreased amid a broad developed market bond rally led by U.S. Treasuries. Peripheral eurozone and UK government bond yields followed the lead of yields in core markets. The European Central Bank (ECB) has announced the end of its bond-buying program by early in the third quarter, to be followed by a rate increase soon after. In the UK, the gross domestic product contracted 0.1% in March contrary to expectations, after it stagnated in February. The contraction was attributed mainly to a decline in service sector activity.
In Japan, stock markets fell in weekly trading due to the U.S. Fed’s adoption of restrictive monetary policies, worries of a slowdown in global economic growth, and concerns about the repercussions of the Russia-Ukraine hostilities. Some support was provided by broad positive earnings reports and renewed expansion in the service sector business activity. The Nikkei 225 Index dropped by 2.13% while the broader TOPIX Index also descended by 2.70%. The yield on the 10-year Japanese government bond ended the week hardly changed at 0.24%. On the other hand, the yen rose against the U.S. dollar, ending at around JPY 128.12 per USD from its previous level at JPY 130.41; still, the currency remained at depressed levels.
Chinese equities rallied on the back of improved investor sentiment due to falling coronavirus cases and positive comments from the securities regulator. The broad, capitalization-weighted Shanghai Composite Index gained 2.7% while the blue-chip CSI 300 Index, which is comprised of the largest listed companies in Shenzhen and Shanghai, rose by 2.1%. The China Securities Regulatory Commission indicated that it shall increase the participation of institutional investors in the country’s equities markets. It also aims to expand the investible universe of the exchange link with Hong Kong. The yield on the 10-year Chinese government bond slid to 2.834% from 2.848%, in reaction to reassurances from the People’s Bank of China (PBOC) that it will maintain reasonably sufficient liquidity and stable credit growth in its first-quarter monetary policy report. The yuan weakened against the U.S. dollar, to CNY 6.80 per USD from CNY 6.67 the week earlier. This marks a 5% slide against the U.S. currency in the last three weeks. The principal factors driving the yuan’s slump are the rising U.S. interest rates, the Russia-Ukraine war, and slowing domestic growth.
The Week Ahead
Retail sales, manufacturing production, and jobless claims are among the important economic data being released this week.
Key Topics to Watch
- Empire state manufacturing index
- Retail sales
- Retail sales excluding vehicles
- Industrial production index
- Capacity utilization
- NAHB home builders’ index
- Business inventories (revision)
- Building permits (SAAR)
- Housing starts (SAAR)
- Philadelphia Fed manufacturing index
- Initial jobless claims
- Continuing jobless claims
- Existing home sales (SAAR)
- Advance services report
Markets Index Wrap Up