

Benchmark indexes have recouped half their losses in a little over three weeks — perhaps too fast
The S&P 500 Index, since its Dec. 24 low at 2,351 points, has rallied 13%.
In fact, the S&P 500 SPX, +1.32% Dow Jones Industrial Average DJIA, +1.38% and Nasdaq COMP, +1.03% have recovered about half of last year’s losses. Does this mean the bear market is over?
The weight of evidence suggests yes, but there is one caveat.
In December, the S&P 500 tagged the 48-month SMA (simple moving average), a level that’s ended a number of bear markets. (More details available in this MarketWatch article.)
The S&P 500 also reached (and exceeded) the average “bear market target.” This target is based on the trajectory of the past 10 bear markets (as defined by Ned Davis Research).
The chart below (originally published in the Dec. 19 Profit Radar Report) plots the S&P 500 against the average bear market trajectory.
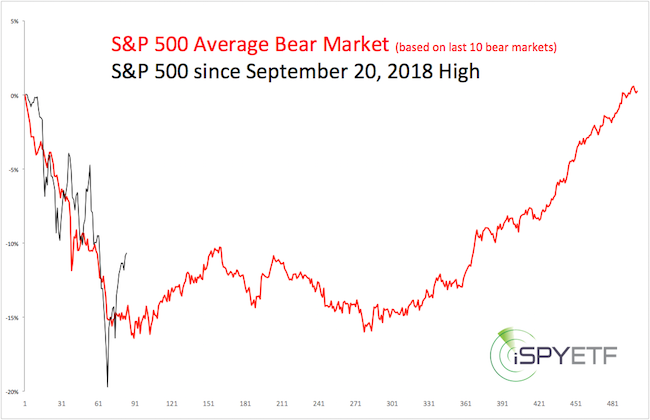
Ironically, bear markets tend to end right about when most people think it started. This one may have been no different, as the headlines below show:
• CNBC: “We Are Now in a Bear Market” — Dec. 24
• Yahoo! Finance: “S&P 500 Enters Bear Market” — Dec. 24
• Investors Business Daily: “S&P 500 Enters Bear Market” — Dec. 24
Seasonality
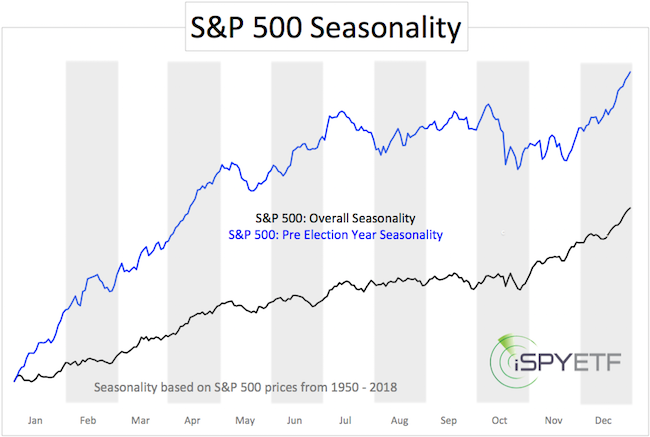
Historically — dating to 1950 — the S&P 500 drops about 20% in the mid-term election year, which is what happened in 2018, a mid-term election year.
Based on the same historical data, the S&P 500 rallies, on average, 50% from the mid-term election year (2018) to the pre-election year (2019) high.
The pre-election year is the best-performing year of the election-year cycles. The S&P 500 seasonality chart, below, illustrates the average performance of the S&P 500 during pre-election years and every year.
Breadth
On Dec. 26 and Jan. 4, 87% and 91% of NYSE-traded stocks advanced, respectively. This kind of “breadth thrust” has happened only five other times since 1985, and was bullish four of five times. A more detailed explanation is available in this MarketWatch column.
Caveat
The S&P 500 recovered more than half of its prior bear-market loss in only 17 days. That’s one of the fastest recoveries in history, and generally leads to some short-term weakness.
In January/February 2016, the S&P 500 also bounced from the 48-month SMA, and enjoyed a breadth thrust, but retested the original panic low before moving higher.
Since there was no bullish divergence at the December low, stocks could retest that low (like in 2016), to carve out a bullish divergence before moving higher.
Summary
The weight of evidence suggests that the bear market is over, but chasing price at this point comes with elevated risk. A “buy the dip” approach seems appropriate. The dip should be at least 100 points, but could be as much 300 points.