Key Takeaways:
Stock Market breadth and momentum moving in the right direction as stocks move to new highs. Even with improvements, breadth is following price higher, not leading.
Investor sentiment data shows that optimism is getting excessive.
The lack of a breadth thrust does not preclude a continued rally, though the emergence of one would be a positive development from a breadth perspective.
The S&P 500 has rallied into record territory, surpassing its January high after a seven-month period of consolidation. Both breadth and momentum on the index are seeing some near-term improvement, but remain shy of the levels seen in January.
Continued resolution of these breadth divergences could provide the S&P 500 with a tailwind into 2019, especially once the seasonal backdrop becomes more favorable.
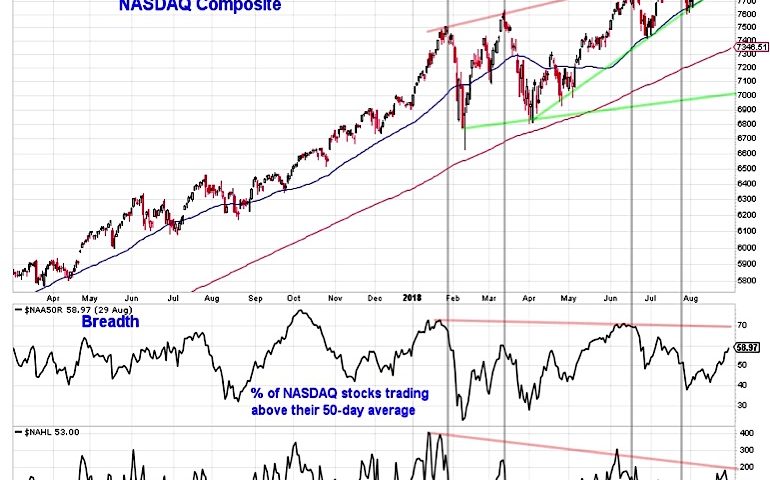
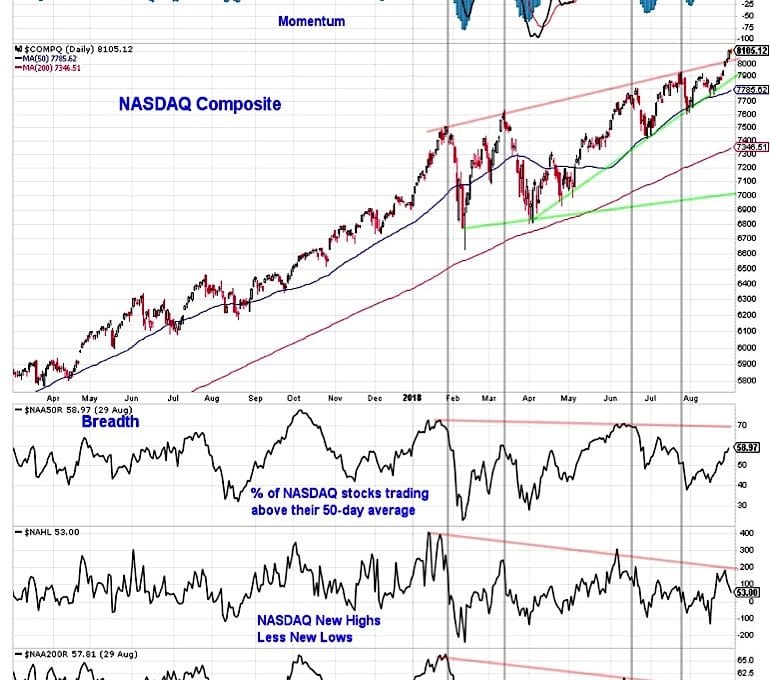
Nasdaq Composite
While the breadth and momentum divergences on the S&P 500 may be working toward resolution, they persist when looking at the NASDAQ Composite. From a price perspective the NASDAQ has made a series of higher highs and higher lows, momentum and breadth have been generally trending lower. If the current foray into record territory stops shy of resolving these divergences, price could quickly reverse. If that happens, 7900 to 8000 could be an initial area of support.
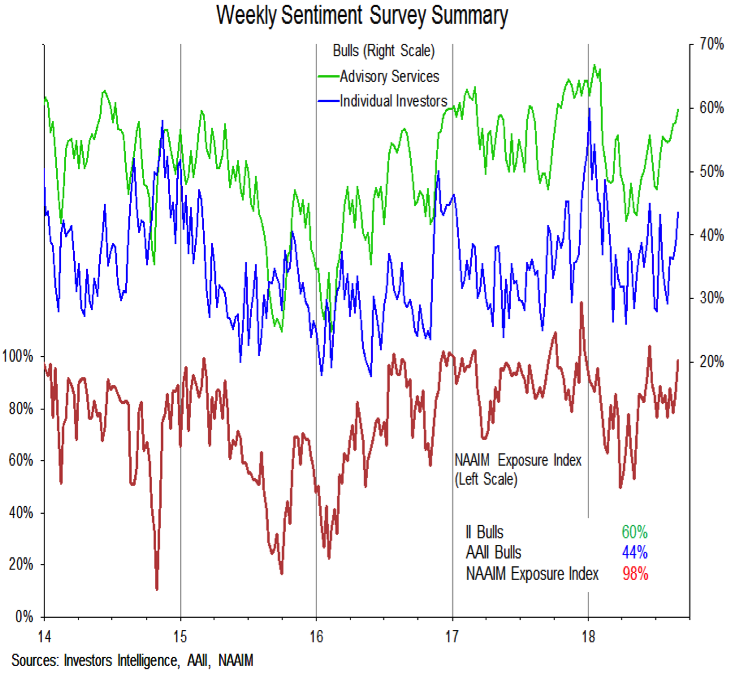
Investor Sentiment
The rally back to new highs for stocks has brought in increased optimism from investors. Bulls on the Investors Intelligence data are climbing toward their January peak and the NAAIM exposure index is at its second-highest level of 2018 (eclipsed only by a short-lived surge in June). Even the bulls on the AAII survey, which have been more restrained than the other indicators of optimism, are moving higher. That all three of these surveys are moving toward excessive optimism in unity is worth noting. Further, sentiment has a tendency to peak before price, so these indicators may not need to reclaim their previous highs to suggest that risks have risen from a sentiment perspective.
In addition to the evidence of optimism from the weekly investor surveys, the NDR Daily Trading Sentiment Composite has this week moved back into the excessive optimism zone. Over the past few years the best gains in the market have come when this indicator has been in the extreme pessimism zone and stocks have struggled to hold on to gains when optimism has been excessive.
As mentioned at the outset, there is evidence that the move into record territory for the S&P 500 is producing some broad market improvement. Here we look at two areas where that improvement is not so apparent.
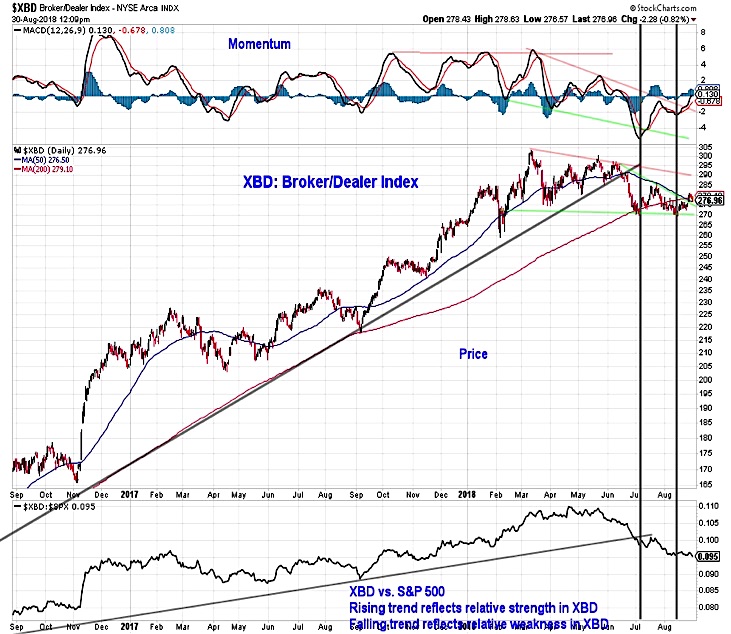
Broker / Dealers Concerns
Broker/dealers typically are a leading indicator for the broader market. After seeing early-year strength, the XBD index has struggled from both a price and momentum basis and has lost relative strength versus the S&P 500. If it is leading, it is pointing lower. From a short-term perspective, the price trend may be improving, with momentum providing a positive divergence. From an intermediate-term perspective, XBD remains in consolidation mode, and from a longer-term perspective, the trend has deteriorated as the 50-day average has crossed below the 200-day average.
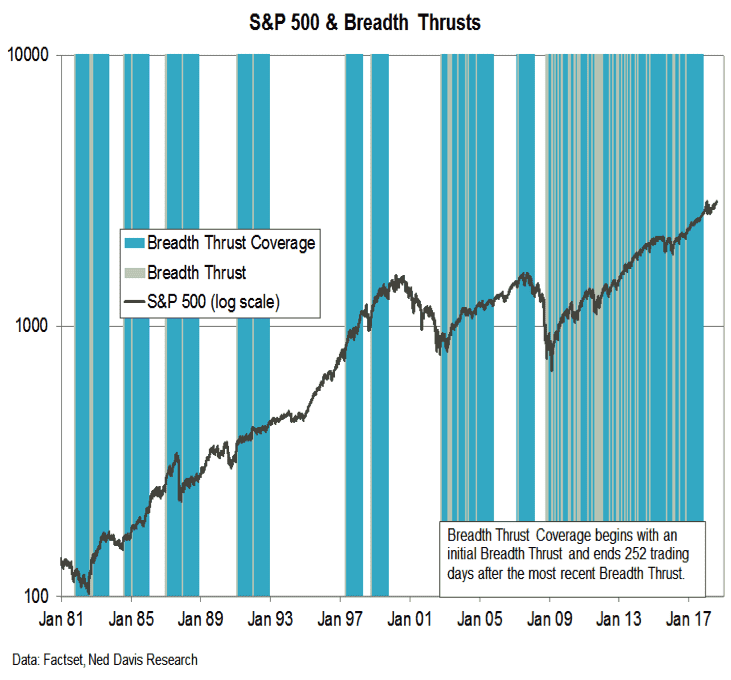
Market Breadth Thrusts – History
As we have mentioned in the past, the rally off of the 2018 lows has been remarkable in that it has not produced a breadth thrust based on any of three primary measures (looking at the percentage of stocks trading above their 10-day or 50-day averages or the 10-day advance/decline ratio). The mid-1990’s are a clear example on this chart where stocks rallied for a protracted period of time without producing a breadth thrust. But overall since 1981 the annualized return for the S&P 500 during periods covered by breadth thrusts has been three-to-four times what it has been in periods not covered by breadth thrusts.