
US equity markets have seen a dramatic fall over the last week. There have been a few reasons why the sell-off has taken place, but no one key moment that led to the selling.
The SPX has dropped 200 points in a matter of days after yields started rising in the US and fears around future growth started to become a very real proposition.
At the same time, it is now clear that the tariffs on China are here to stay and that ultimately means yet another tax on the American people.
Over the last few years, all sell-offs have quickly been met with an equally quick buying frenzy. As buying-the-dip has been all the rage.
However, this week we have seen a key indicator get triggered and it could spell trouble for equity investors.
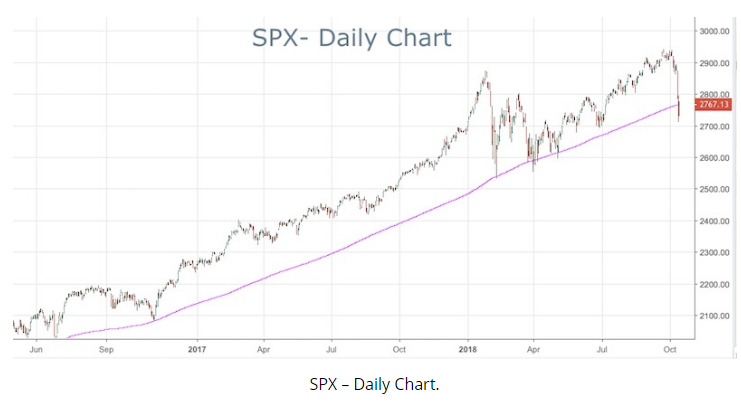
Technical Outlook
The key indicator for many long-term investors and those in the asset allocation business is the 200-SMA.
This is often referred to as a “regime filter” and it isn’t a sell or buy signal as such. Basically, when price is below the 200 SMA, markets are more likely to crash. Look back at the charts of the period through 2007-2009.
Price only crashes severely when we get below the 200-SMA. The same type of process is true of stocks. You never see a stock crash from its highs.
It’s a slow period of grinding lower, before the washout at the bottom.
That’s why institutions and big money player watch the 200-SMA. This week we’ve have closed just on top of that mark. But we are close. We actually did close below it during the week.
Even earlier in the year, the SPX didn’t really break the 200, despite all the volatility and headlines. So keep a close watch this week as if we hold below, we could well be in for some increased volatility ahead.